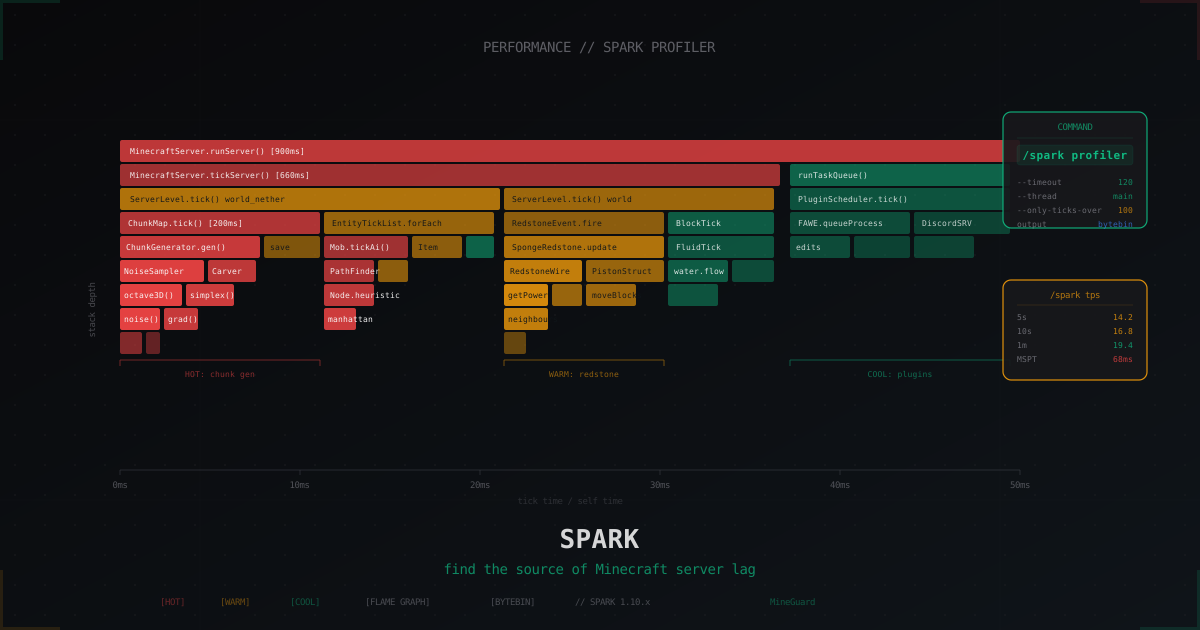
Spark profiler: how to find Minecraft server lag source in 2026
Server is dragging, TPS sits around 14, chat is full of "lag" complaints, and you have no idea who is eating the tick. A few years ago you would type /timings paste and know the offender within a minute. Today, Timings inside Paper is effectively dead (off by default since 1.20.5, removed entirely in 1.21+), and Aikar's Timings v2 as a standalone product hasn't been maintained for years. Spark by lucko has taken over, and over the last two years it became the industry default: PaperMC recommends it, Mojang bug reports cite it, Purpur, Folia, Fabric and most large modpacks ship with it.
This article walks through installing Spark in 2026, capturing a useful profile from a production server, reading flame graphs without turning into a shaman, and pulling the actual culprit out of the call tree, whether it's a plugin, a chunk, or the garbage collector.
What Spark is and why it replaced Timings
Spark is a sampling profiler for the JVM, tuned for Minecraft. Instead of instrumenting code like the old Timings, it takes stack snapshots of every server thread at a fixed frequency. Those snapshots build into a call tree and a flame graph that show where the server actually spends CPU time.
The key difference from Timings: Spark doesn't say "Plugin X spent N ticks handling events". It says "this exact method, in this exact stack, was hot on CPU". That gives you an honest picture, including things Timings never saw: Mojang internals, heavy logic inside plugins, lambdas, native code, GC pauses.
Why Timings left the stage: it was bundled into Paper, carried its own overhead, only measured what was wrapped in a timer, distorted the picture under async code, and missed GC entirely. Paper 1.20.5 turned Timings off by default; 1.21 removed it. Spark, by contrast, runs on every version from 1.8 to 1.21.x, on Spigot, Paper, Folia, Fabric, Forge, NeoForge, Velocity and BungeeCord.
Spark's author is lucko, the maintainer of LuckPerms. Development happens in the open on github.com/lucko/spark, the official site is spark.lucko.me, and the plugin ships through Hangar (hangar.papermc.io/lucko/spark) and Modrinth (modrinth.com/plugin/spark). As of April 2026 the active branch is 1.10.x, supporting Java 21 and servers up to 1.21.5.
Installing on different platforms
Spark ships as a single universal JAR with platform autodetection, plus dedicated builds for Fabric and Forge. Download from spark.lucko.me/download or Modrinth, never from reupload sites.
Spigot, Paper, Purpur, Folia. Drop spark-1.10.x-bukkit.jar into plugins/ and restart. After startup, /spark becomes available under the spark permission. By default only operators have access; for non-OP players grant the node through LuckPerms: lp user <name> permission set spark true.
Velocity. Use spark-1.10.x-velocity.jar in the proxy's plugins/. On a proxy Spark is especially useful for catching lag in plugin-message handling, login flow, LiteBans, ChatRegulator, and similar heavyweight plugins.
BungeeCord and Waterfall. A separate spark-1.10.x-bungeecord.jar exists. Same commands, same flags. Note that Bungee/Waterfall are considered legacy in 2026; migrating to Velocity is the recommended path.
Fabric. Quilt and Fabric share spark-1.10.x-fabric.jar in mods/, depending on Fabric API. For server-only installs, use the server build; the client has a separate spark-fabric-client artifact.
Forge and NeoForge. Forge 1.20.1 and below: spark-1.10.x-forge.jar in mods/. NeoForge 1.20.4+ has its own spark-neoforge JAR. Commands are identical, op-only access by default, finer permissions through FTB Ranks if you use them.
Sponge. Use spark-1.10.x-sponge.jar. SpongeForge takes it in mods/, SpongeVanilla in plugins/.
After install, type /spark to confirm the help text appears. If you get "unknown command", check latest.log; the plugin may be complaining about an old Java version (17+ required, 21 recommended).
Core commands: /spark profiler, /spark tps, /spark health
Spark is a set of subcommands under /spark. Here are the ones used 95% of the time.
/spark tps
Shows current TPS and MSPT (milliseconds per tick) broken down by interval:
TPS from last 5s, 10s, 1m, 5m, 15m:
  *14.2, *16.8, 19.4, 19.8, 19.9
Tick durations (min/med/95%ile/max ms) from last 10s, 1m:
  3.2 / 12.4 / 48.1 / 220.5
The asterisk marks values below target. The 95th percentile MSPT is the most useful number: it ignores the average and shows what 95% of ticks were faster than. If 95%ile sits above 50ms consistently, you have a problem even when the average TPS looks pretty.
/spark profiler
The headline command. Starts a sampling profiler on the main server thread by default. Without arguments it runs until you stop it via /spark profiler stop.
/spark profiler start
... wait 60-300 seconds during the lag ...
/spark profiler stop
On stop, Spark uploads the result to bytebin (its public binary pastebin) and posts a chat link like https://spark.lucko.me/abc123def. Open the link in a browser and work with the interactive viewer.
Useful flags:
--timeout 120, auto-stop after 120 seconds. Handy when lag is recurring and you want a fixed window.--thread *, profile every JVM thread, not just Server Thread. Required when async plugins, GC, or Netty are suspect.--only-ticks-over 100, save stacks only for ticks longer than 100ms. The golden mode for rare freezes inside an otherwise healthy TPS.--interval 10, sample every 10ms (default 4ms). Lighter footprint on long captures.
/spark health
A newer command that replaced /spark tickmonitor. Quick JVM overview:
Server Health Report:
  TPS: 18.4 (last 5s)
  CPU: 64% (process), 82% (system)
  Memory: 8.4G / 12G heap
  GC: G1 Young 12 collections, 340ms total
  Disk: /world 240G free of 500G
If system CPU is high while process CPU is low, something else on the box is eating CPU, the classic shared-host scenario.
/spark heapsummary and /spark heapdump
/spark heapsummary is a lightweight snapshot: how many objects of each class live in the heap and how much they weigh. Enough to catch a plugin memory leak: when you see org.bukkit.craftbukkit.v1_21_R1.entity.CraftItem at 480000 instances, somebody is not cleaning up dropped items.
/spark heapdump is a full hprof dump for VisualVM or Eclipse MAT. Only run it when heapsummary didn't answer the question: the dump goes to disk, can be gigabytes, and the server stalls during the write.
/spark gc
Garbage collector stats since server start. Useful for comparing how much wall clock the JVM spent in GC pauses versus useful work. Above 5% is bad news; above 15% means broken Java flags or a memory leak you need to chase.
Reading flame graphs: Self time vs Total time
The graph viewer at spark.lucko.me is an inverted flame graph: the call root sits at the top, leaves at the bottom. Each rectangle is a method, width is proportional to time spent in that method. Wider equals hotter.
Total time includes time spent in the method itself plus all of its callees. The root has 100% Total. Use it to pick the branch that pulls the most CPU as a whole.
Self time counts only time spent directly inside the method, excluding children. It narrows down to the actual hot leaves. Self time is how you find the bad code.
Practical rule: look at Total to choose a branch ("60% of time is inside ChunkMap.tick"), switch to Self time and walk down that branch until Self peaks. The leaf where Self maxes out is the actual function in trouble.
Spark colours rectangles by code source: Mojang/NMS in one shade, plugins in another, JVM in a third. Toggle "Colour by source" in viewer settings and a single misbehaving plugin lights up red. Ctrl+F searches the tree by package (com.discordsrv), class (AsyncCatcher), or method name. The "Sources" tab groups the entire tree by origin, instantly showing the top three offenders.
Common lag culprits and how Spark shows them
Chunk loading and generation. Tree path: ServerLevel.tick -> ChunkMap.tick -> ChunkGenerator.generate. If this branch eats 30%+ of Total, you're either looking at players exploring fresh territory or a plugin loading chunks on its own (dynmap, anti-AFK teleports, ad plugins with auto-tp). Fix: pre-generate via Chunky, cap view-distance at 8-10, disable forced chunk loading in third-party plugins.
Entity tick list. Branch EntityTickList.forEach -> Mob.tickAi -> PathFinder.findPath. Pathfinding eating 20%+ usually means stuck mobs (a packed cow pen) or villagers with broken AI. Diagnose with /spark profiler --only-ticks-over 100, then kill @e[type=cow,distance=..200] for that pen, or enable Lobotomize villagers in Purpur.
Redstone. ServerLevel.tickBlock -> RedstoneWireBlock.updateState. This branch flares up on technical/factions servers. Fix: redstone-implementation: ALTERNATE_CURRENT in paper-world-defaults.yml, replace clock circuits with observers or comparators.
Garbage collector. GC shows up as wide rectangles in G1 Young Gen, G1 Concurrent, ZGC Concurrent threads. If a --thread * profile shows GC consuming 10%+ of wall clock, your Java flags are wrong or you're underprovisioned. Verify -Xms equals -Xmx, try G1 with aikar flags, or ZGC on Java 21.
The bad plugin. Classic case: under --thread * you find one plugin in pool-7-thread-1 that constantly burns CPU on Socket.connect, JDBC.executeQuery, or URL.openStream. That's the "async" plugin hammering an external API on every event. Find the plugin name in the stack and disable it or yell at the author.
Auto-save. Every 5-10 minutes a big Self time spike appears at ChunkSerializer.write and RegionFile.write. Normal up to a point, but if auto-save tanks TPS from 20 to 10 you have slow disk (HDD instead of NVMe) or a too-large world that needs paper trim or chunky trim.
Sharing the report
Once the profiler stops, the chat/console prints a bytebin link like https://spark.lucko.me/abc123def. Anyone with that link sees the interactive viewer.
Things to know:
- Bytebin links last a long time but not forever. If you need the profile long-term, click "Download" in the viewer to save the
.sparkprofile. - Profiles are public, the link opens with no auth. Stack traces leak package and class names, sometimes player names through lambdas, sometimes filesystem paths.
- The viewer has an "Anonymize" toggle that masks player names and paths.
For plugin author support: the bytebin link is exactly what people on the PaperMC, EssentialsX, or any large plugin Discord will ask for. Don't paste screenshots, don't quote log lines, send the link.
Spark commands cheatsheet
| Command | What it does | When to use |
|---|---|---|
/spark tps | Current TPS + MSPT by interval | Quick sanity check |
/spark profiler start | Start the profiler | Lag investigation on main thread |
/spark profiler stop | Stop and upload report | After enough sample time |
/spark profiler --timeout 120 | Auto-stop after 120s | Lag is recurring, set and forget |
/spark profiler --thread * | All JVM threads | Async plugins, GC, Netty suspected |
/spark profiler --only-ticks-over 100 | Only ticks longer than 100ms | Rare freezes in healthy TPS |
/spark profiler --interval 10 | 10ms sampling interval | Long captures, lower overhead |
/spark profiler info | Current profiler status | Confirm a run is in progress |
/spark profiler cancel | Cancel without report | Changed your mind |
/spark health | JVM health: CPU, RAM, GC, disk | First glance on lag complaints |
/spark heapsummary | Lightweight heap object summary | Memory leak hunting |
/spark heapdump | Full hprof dump to disk | Deep leak analysis in MAT |
/spark gc | GC stats since server start | GC pause diagnostics |
/spark ping | Players' server-side ping | Network triage |
/spark activity | Recent plugin activity log | What ran lately and who triggered it |
Advanced options
Comparing profiles. The viewer has a "Compare" button that diffs two captures. Useful after optimization: capture before and after, see which branch actually shrank. Sometimes you fix one thing and bloat another, like disabling dynmap only for Essentials to start writing to disk more often.
Profiling Folia. Folia, the multi-threaded Paper fork, runs several Region Threads. Spark catches each one and the viewer shows them as separate trees. On Folia --only-ticks-over is especially valuable for finding which region falls behind.
Config. The file plugins/spark/config.json lets you change the bytebin URL (for self-hosted instances), force private viewer URLs (viewer-url-only-private: true), and enable automatic profile capture when TPS drops below a threshold:
{
  "profiler": {
    "auto": {
      "enabled": true,
      "trigger-tps": 10.0,
      "duration": 90
    }
  }
}
With that config Spark grabs the next freeze itself, no babysitting required.
REST API. Spark exposes a REST API through bytebin, so capture and storage can be automated. lucko has a sample script in the repo, handy for large networks.
Comparison with Timings and Aikar's Timings v2
| Aspect | Timings (Paper) | Timings v2 (Aikar) | Spark |
|---|---|---|---|
| Status in 2026 | Removed in Paper 1.21+ | Unmaintained | Actively developed |
| Method | Instrumentation | Instrumentation | Sampling |
| NMS code coverage | Limited | Limited | Full |
| Async threads | No | Partial | Full |
| GC pause visibility | No | No | Yes |
| Overhead | Medium | Medium | Low (1-2%) |
| Folia support | No | No | Full |
| Fabric/Forge support | No | No | Full |
| Report sharing | timings.aikar.co | timings.aikar.co | spark.lucko.me |
| Profile diff | No | No | Yes |
| Heap analysis | No | No | Yes |
Practical takeaway: if you still run Timings (on Paper 1.20.4 or older), switch to Spark today. There's no reason to run both, the overhead stacks. Aikar's Timings v2 as a standalone product can be forgotten; the author moved to Spark himself and recommends it in his Java flag guides.
FAQ
Does Spark slow the server down?
A sampling profiler at the default 4ms interval costs roughly 1% CPU. Less than active Timings ever did. On profiles longer than five minutes the TPS difference stays inside statistical noise.
Can I keep Spark loaded permanently?
Yes, lots of people do. The plugin doesn't profile anything until you run a command. Idle Spark overhead is essentially zero. /spark health runs in the background without recording stacks.
What if bytebin is unreachable?
You can save the profile locally with --save-to-file, or run your own bytebin instance (sources are open on lucko's GitHub). A local viewer also exists: open the downloaded .sparkprofile directly in your browser at spark.lucko.me, it never hits a server.
Will Spark show DDoS?
No. Spark profiles the JVM, it sees what the server itself is doing. External network load (UDP floods, login bot attacks) is invisible to it. For DDoS you need network-layer filtering in front of the server, like MineGuard, then Spark will confirm the lag isn't a plugin but external pressure.
Which profile do I send to a plugin author for a bug report?
At least 60 seconds during real load, with --thread *, plus a /spark health snapshot. If the issue is rare, add --only-ticks-over 100. Note the server version, plugin version, and online count at capture time.
Does Spark work for the Minecraft client?
Yes, dedicated spark-fabric-client and spark-forge-client builds exist. Useful for modpack devs and streamers chasing FPS issues. Same commands, triggered via keybind or chat.
If after half an hour with the flame graph you hit a wall of "everything is hot, I can't tell", that's normal, profiling is a skill. Capture often, diff before and after each change, build pattern memory. After a dozen reports you'll spot ChunkMap.tick and SpongeRedstone from across the room. One more thing to keep in mind: Spark surfaces internal slowdowns, but if the lag is external load (bot attacks, UDP floods, synthetic ping), the profiler will stay quiet because it's not the server, it's the network, and that's where network-grade protection like MineGuard does the job that Spark can't.
Protect Your Server from DDoS Attacks
Free protection with 5-minute setup. 1 TB bandwidth included.
Try for FreeRelated Articles
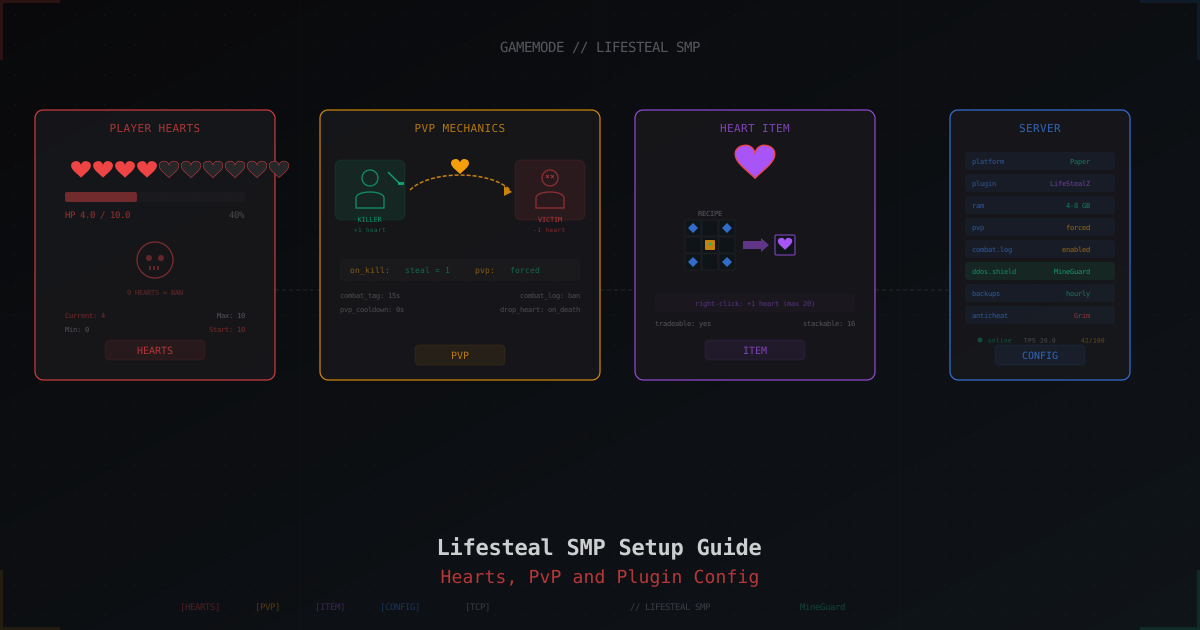
Lifesteal SMP Server: How to Set It Up From Scratch (2026)
Lifesteal SMP is the hottest gamemode on Minecraft YouTube. Kill a player, steal their heart. Zero hearts means permanent ban. Here is the full plugin, config and rules setup.
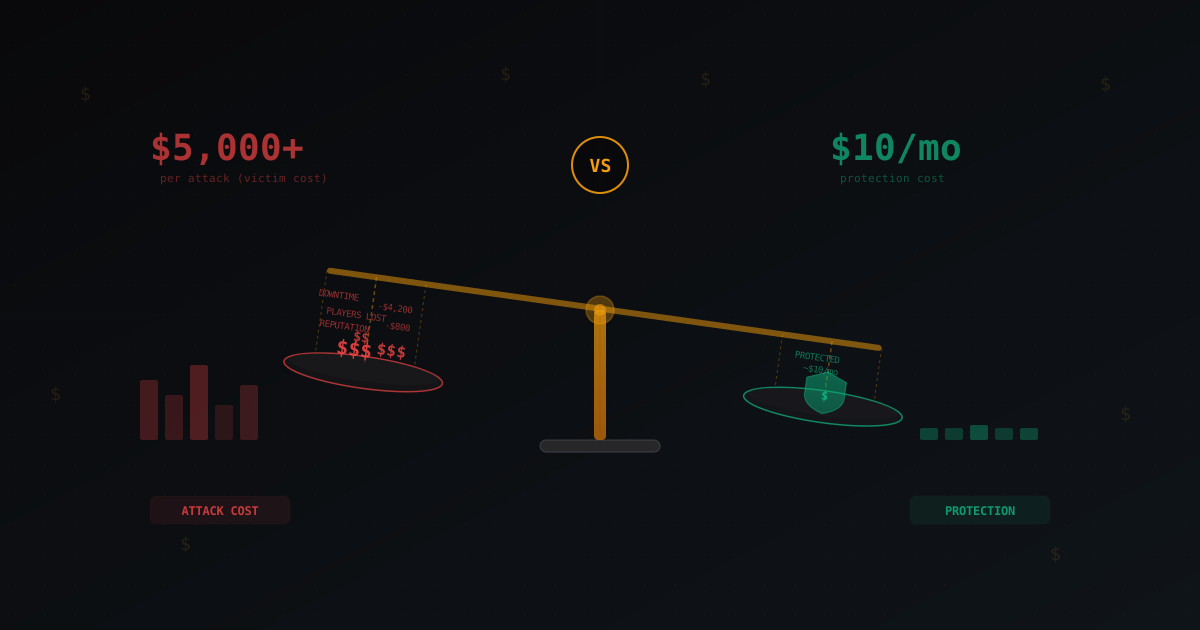
Cost of a DDoS Attack vs Cost of Protection: The Economics of Cyber Attacks
Breaking down real numbers: how much a server owner loses during a DDoS attack, how cheap attacks are to launch, what protection actually costs, and when it pays for itself. ROI calculation for different project sizes.
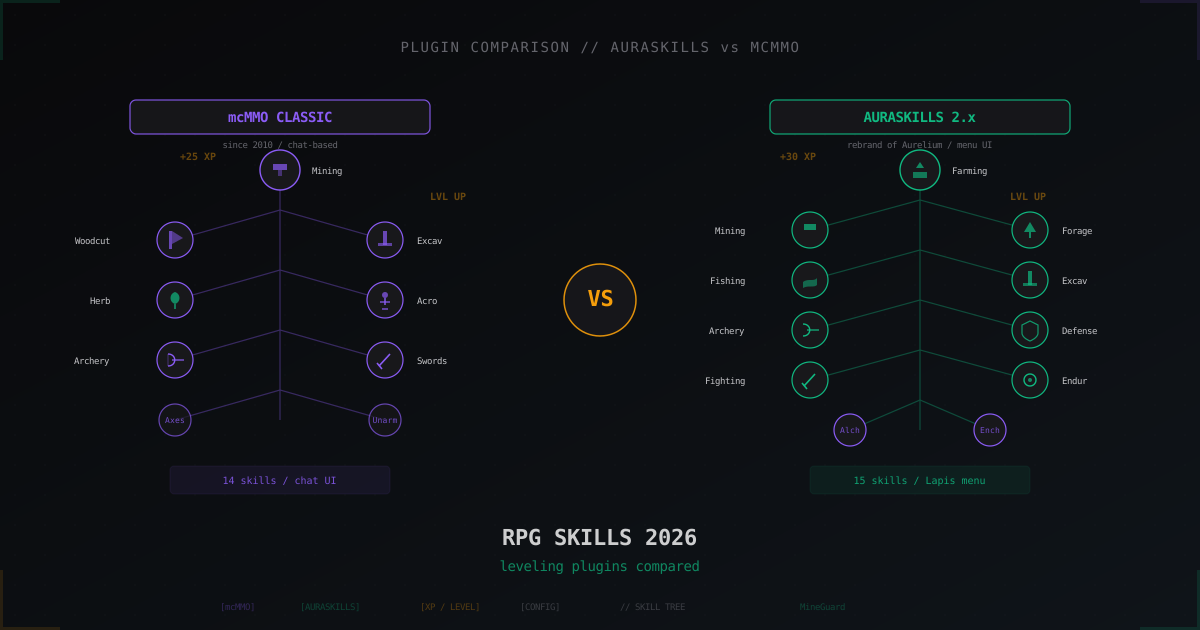
Aurelium Skills (AuraSkills) vs mcMMO: which RPG skills plugin is better in 2026
mcMMO has held the RPG-plugin throne since 2010, AuraSkills (formerly Aurelium Skills) arrived in 2020 and became its main rival in a couple of years. We break down XP formulas, skill systems, UI, integrations and real configs.